Could Vaccinating Young People Before Old People Save More Lives?

Vaccines are tackling the COVID-19 pandemic in two ways: reducing the severity of infections, and preventing their transmission. Both mechanisms save lives, but the vaccination strategies that leverage each can be conflicting. The former encourages vaccination of society's most vulnerable, who may otherwise succumb to severe infections. The latter encourages vaccinating highly connected people who would potentially contribute most to the spread of the virus - i.e. not the homebound infirm.
Many countries have implemented phased vaccination strategies. These typically start with the elderly and frontline healthcare workers, before working their way through younger age groups. The elderly fit the brief of those most vulnerable to infection, whereas frontline healthcare workers are among those with the greatest potential to transmit extensively (and specifically: transmit to the most at risk).
But supporters of a transmission-interrupting strategy might advocate for the vaccination of other groups - such as young people or delivery drivers - before the elderly. This article investigates the implications of vaccinating less vulnerable but more disease-spreading groups ahead of more vulnerable but less disease-spreading groups. The proceeding sections explain the process of constructing simple compartmental models, and how they can be used to simulate different vaccination strategies amongst various populations.
Part 1: An Introduction to SIRD Models
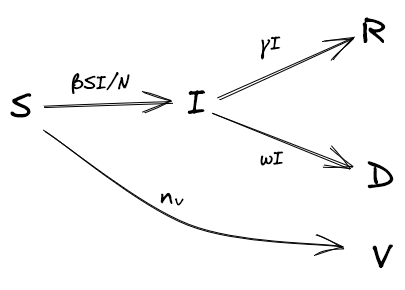
Compartmental models are simple, deterministic approaches for modelling infectious diseases. In a SIRD model, a population is distributed amongst four 'compartments' - Susceptible, Infectious, Removed, Deceased. There are many variants of the SIRD model, but for our purposes, we assume that there are no births, nor deaths that aren't a result of infection, and removed individuals remain in a state of immunity (i.e. they do not become susceptible again). Individuals progress between these compartments over time, as shown below (Figure 2).
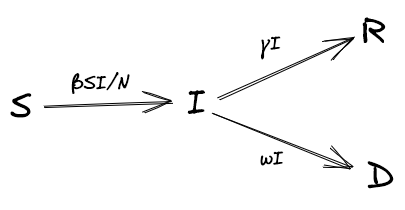
At each time step, infected people move to removed (also referred to as 'recovered') and deceased states according to the rates of recovery and mortality, γ and ω, respectively: \( R_{t+1} = R_{t} + \gamma I_{t} \) and \( D_{t+1} = D_{t} + \omega I_{t} \).
The number of people who move from a susceptible to an infected state is determined by the rate of infection, \( \beta \), multiplied by the number of susceptible people, \( S \), multiplied by the proportion of people they encounter that are infected, \( \frac{I}{N} \), where \( N \) is the number of living people, \( S + I + R \). More formally: \( S_{t+1} = S_{t} - \frac{\beta S_{t}I_{t}}{N_{t}} \) and \( I_{t+1} = I_{t} + \frac{\beta S_{t}I_{t}}{N_{t}} - \gamma I_{t} - \omega I_{t} \).
An Example Based on the UK
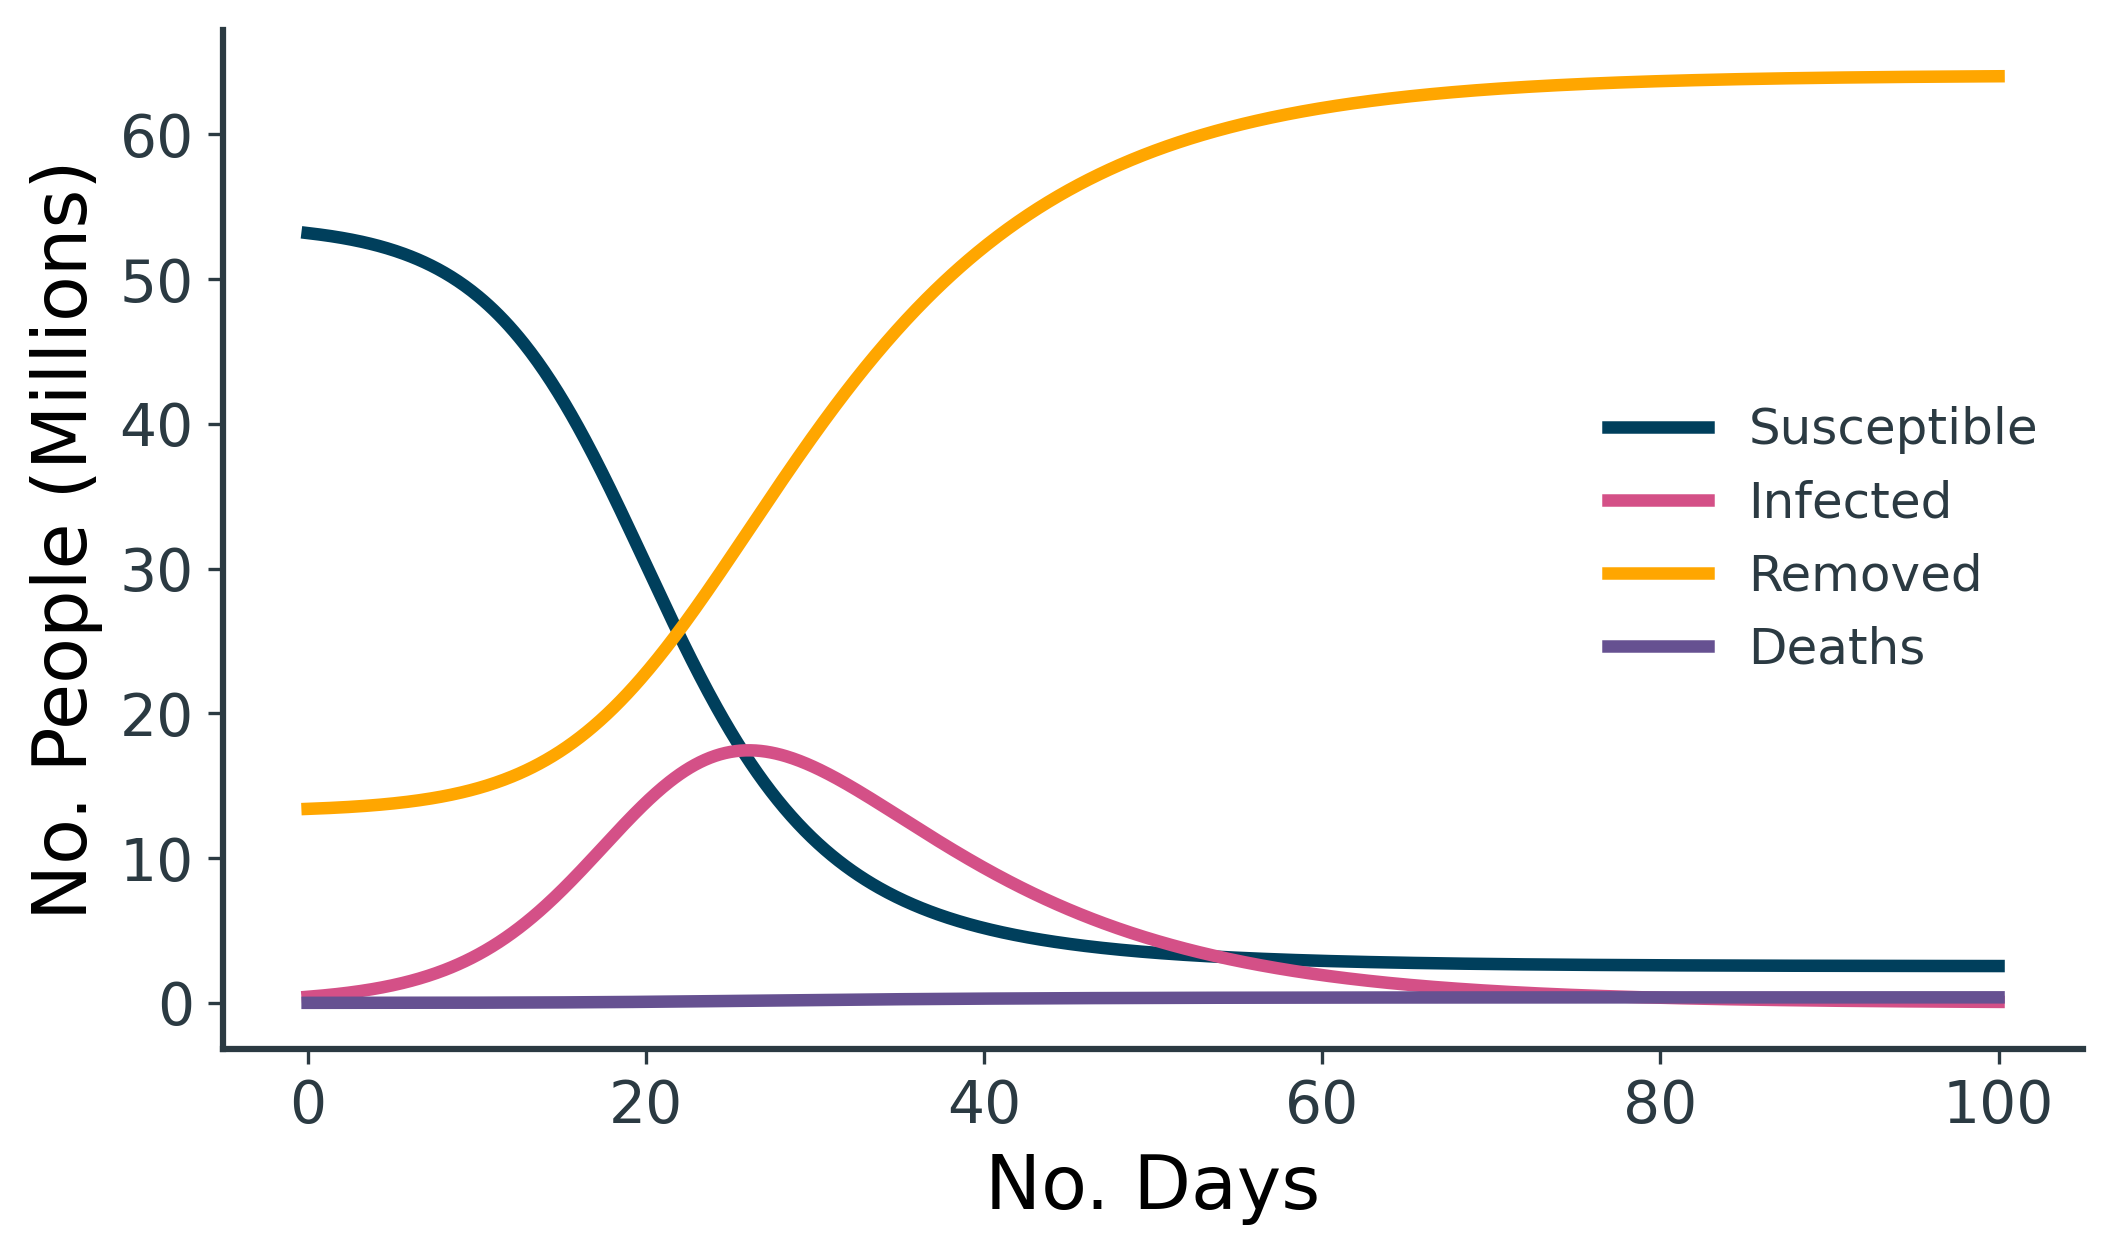
An example SIRD model is shown above (Figure 3), loosely based on the UK. We have an overall starting population of 67M, and we assume 20% of the population have already recovered from COVID-19, such that \( R_0 = 13.4M \). We also assume 1/160 people currently have COVID-19, such that \( I_0 = 419k \). This leaves us with a remaining susceptible population of \( S_0 = 53.2M \).
For the rates, we opt for \( \gamma = 0.1 \), which is equivalent to a 10-day recovery time. For the mortality rate, \( \omega = 0.00075 \) is equivalent to 0.75% of infected people dying (calculated from \( 0.75 = \frac{\omega}{\omega + \gamma} \times 100\)). Finally, we set \( \beta = 0.5 \), as this gives an exaggerated infection curve that peaks nicely at ~17.4M for illustrative purposes. This scenario could perhaps be interpreted as the sort of runaway epidemic that might arise due to rapid spread of COVID-19 in the absence of social distancing measures.
| Start Population | Total Infected | End Susceptible | End Removed | End Deaths | Mortality Rate (%) | |
|---|---|---|---|---|---|---|
| Total | 67M | 51.1M | 2.5M | 64.0M | 380k | 0.74% |
Table 1. A catastrophic outcome for the UK during this contrived 100-day epidemic...
Table 1 shows the result of the above 100-day simulation, with 98.7% of the 53.2M starting susceptible population becoming infected, of whom 380k die.
Structured SIRD Models
In its simplest form, a SIRD model assumes a homogenous population, but we can extend it to simulate a combination of sub-populations. We do so by having distinct S, I, R, D, compartments for each group (e.g. \( S = S^A + S^B + S^C \), \( I = I^A + I^B + I^C \) etc.) for which we specify their own rates of recovery and mortality (\( \gamma^A \), \( \gamma^B \), \( \gamma^C \), \( \omega^A \), \( \omega^B \), \( \omega^C \)). The rate of infection, \( \beta \), is only slightly more complex and can be specified as a matrix of infection rates within and between each group, as below (Figure 4).
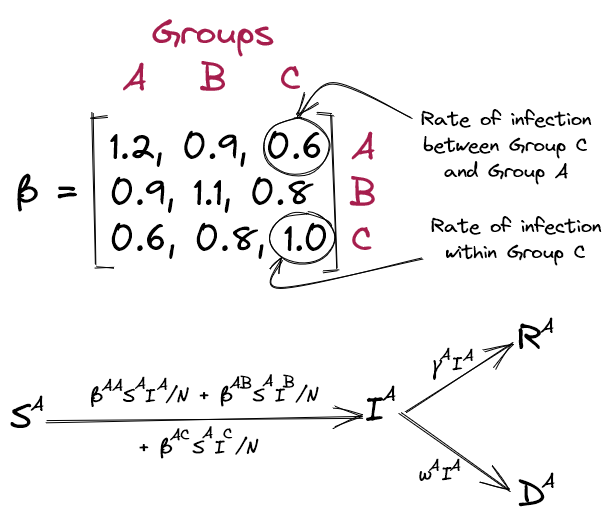
Within this framework, the rate of infection between two groups can reflect the degree of intermixing between them. For instance, in an age-structured model, the infection rate between old and young populations will be much lower than within the young population. For simplicity, we'll make this matrix symmetric, assuming that susceptibility towards infection between two groups is equal in both directions (although the model doesn't necessitate this).
Armed with this simple model, we can repeat the UK simulation but with the population split across separate age groups. We approximate three age groups - <40, 40-80, >80 - each with starting populations of 31M, 31M, and 5M, respectively. We assume once again that 1/160 people are infected, 20% have already recovered from COVID-19, and that the recovery time from infection is 10 days (\( \gamma = 0.1 \)). It's difficult to find reliable data for mortality rates across these age groups, but based on gov.uk, it seems reasonable to approximate the mortality rate for >80 as eight times greater than for 40-80, which itself is eight times greater than <40. The values shown below (Table 2) produce an overall mortality rate of 0.77% which is comparable to our standard SIRD model above.
| Age Group: | <40 | 40-80 | >80 |
|---|---|---|---|
| S0 | 24,606,250 | 24,606,250 | 3,968,750 |
| I0 | 193,750 | 193,750 | 31,250 |
| R0 | 6,200,000 | 6,200,000 | 1,000,000 |
| γ | 0.1 | 0.1 | 0.1 |
| ω | 0.0001 | 0.0008 | 0.0064 |
| β with <40 | 0.9 | 0.4 | 0.1 |
| β with 40-80 | 0.4 | 0.5 | 0.2 |
| β with >80 | 0.1 | 0.2 | 0.25 |
Table 2. Parameters used for age-structured SIRD model, loosely based on the UK.
It's hard to find scientifically grounded values for \( \beta \), but in keeping with the hypothesis that transmission rates are higher in the young population, we assume that the transmission rate within age groups decreases with age. We also assume that the transmission rate within age groups is higher than between age groups. The values in the above table are entirely subjective but produce reasonable results for exploring the question at hand.
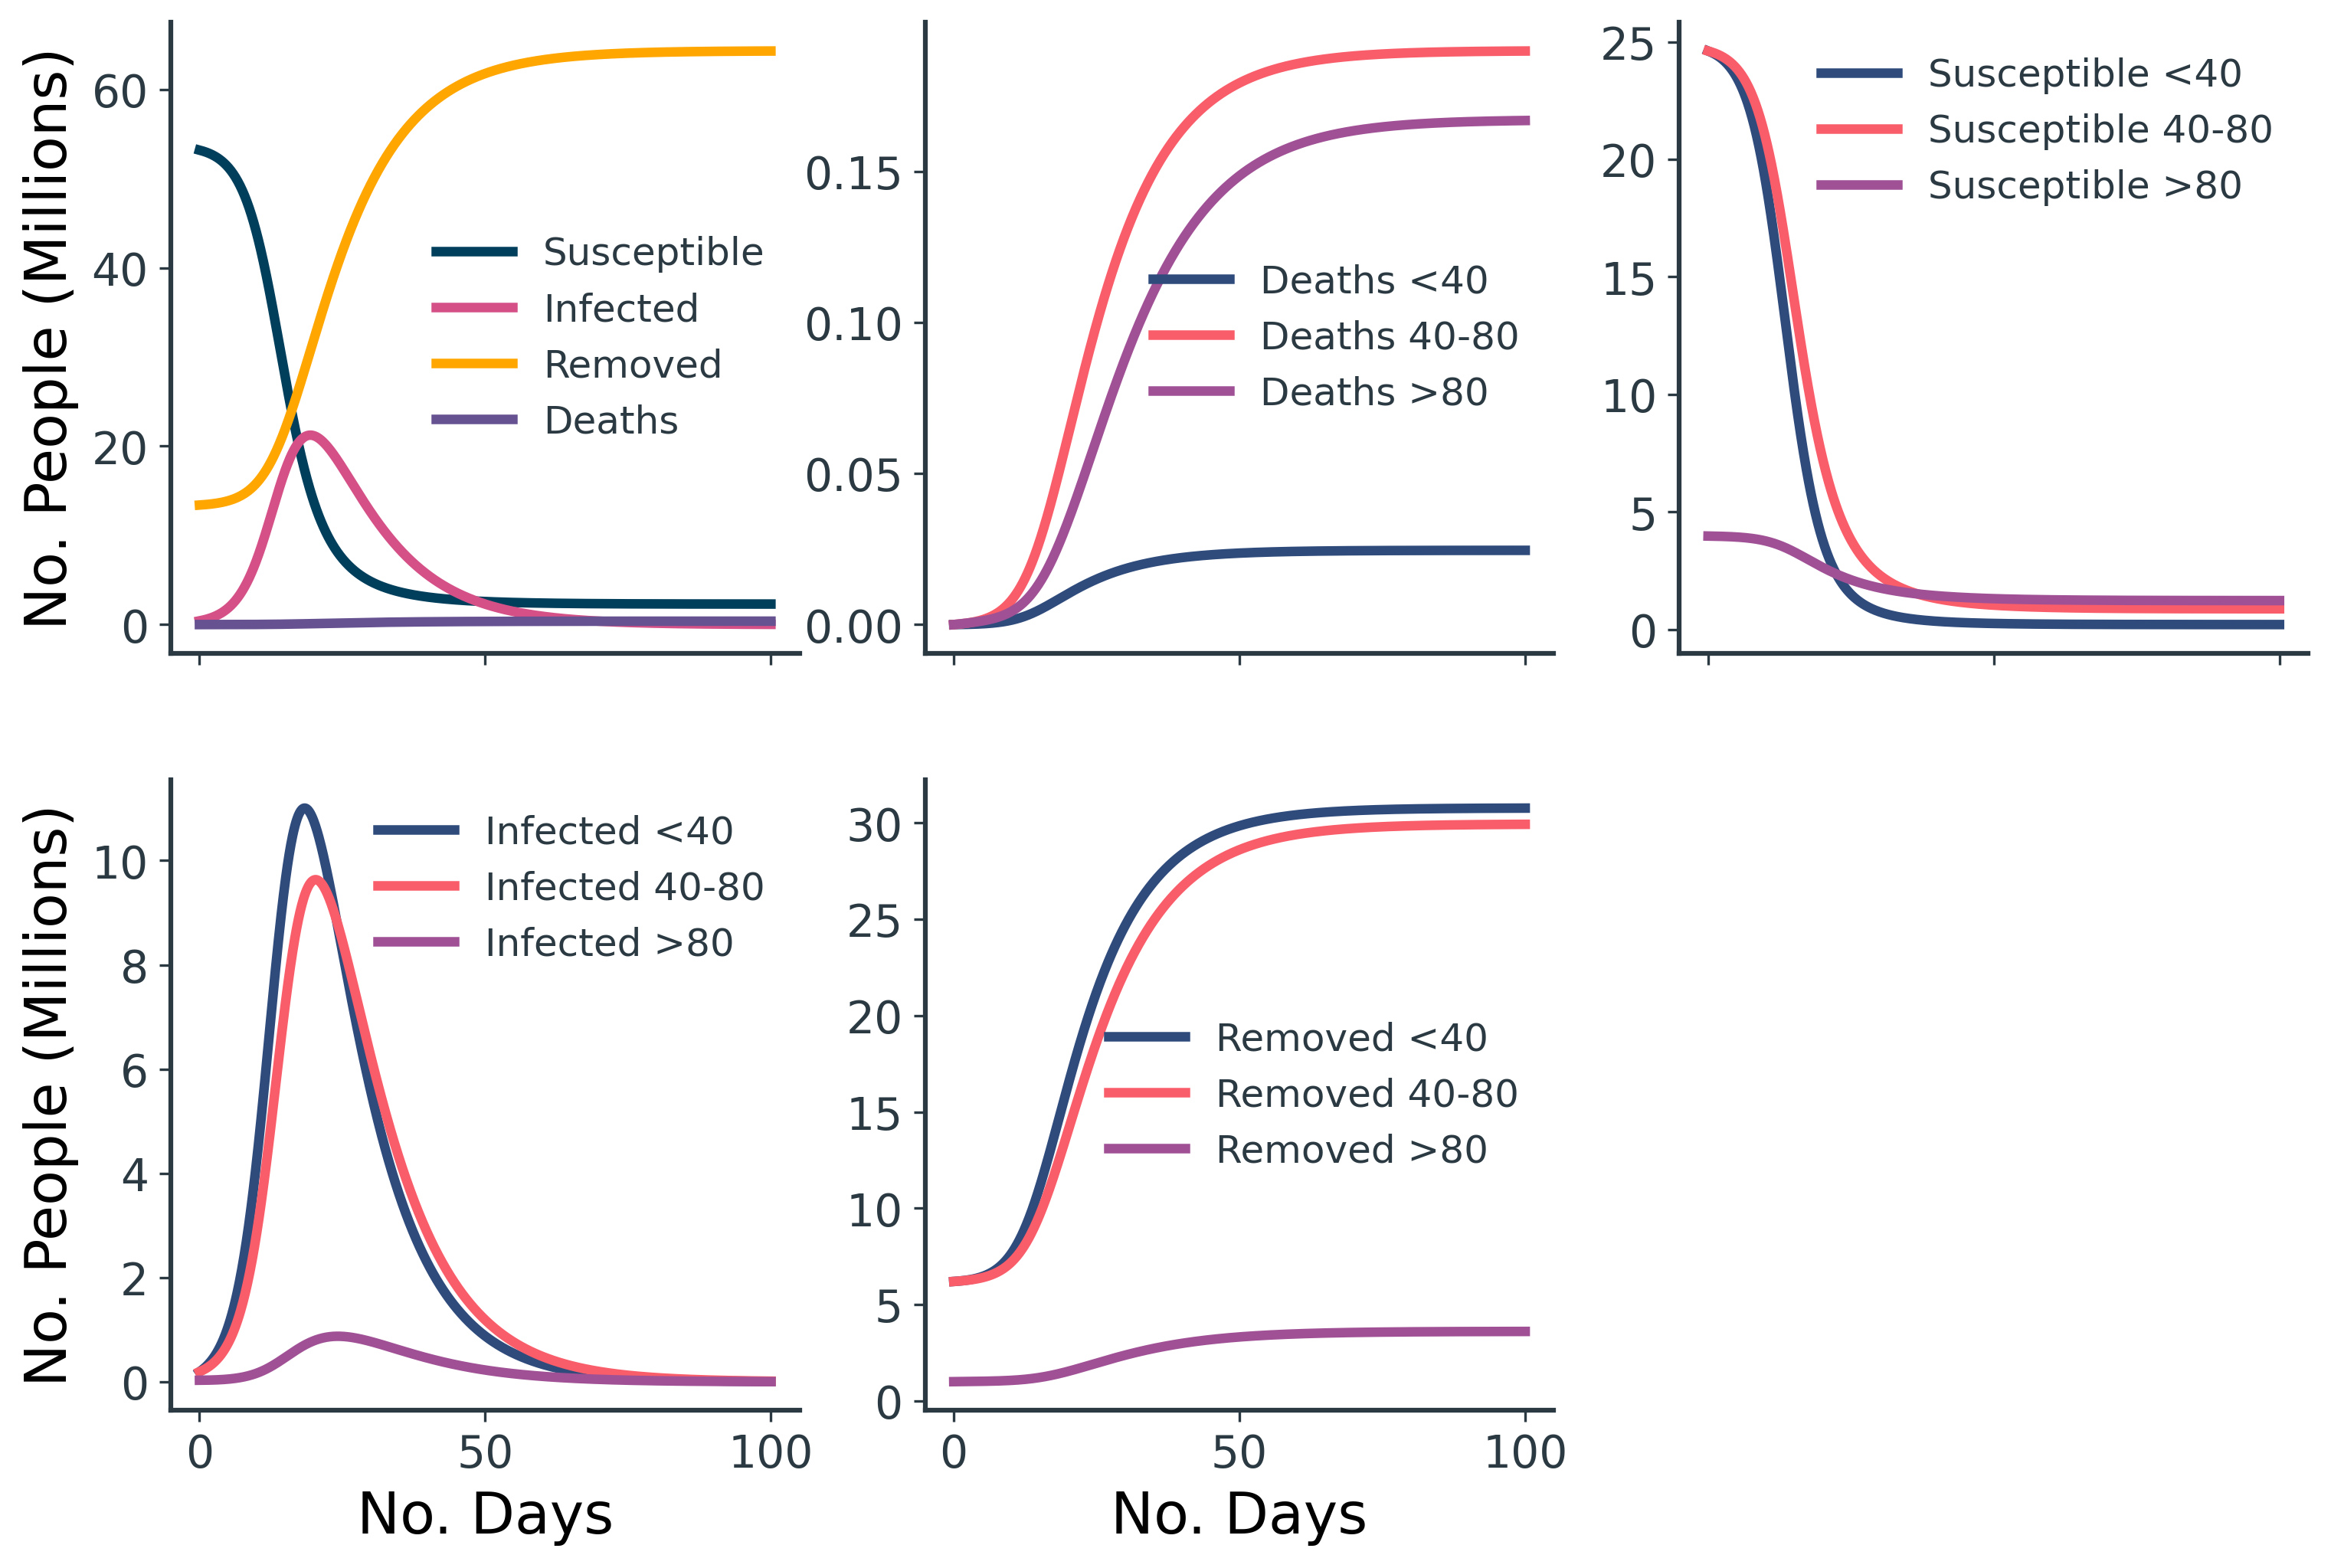
The age-structured results (Figure 5 and Table 3) are comparable to our original UK SIRD model, but we can now see the compartments split across the three age groups.
| Start Population | Total Infected | End Susceptible | End Removed | End Deaths | Mortality Rate (%) | |
|---|---|---|---|---|---|---|
| <40 | 31M | 24.6M | 203k | 30.7M | 25k | 0.10% |
| 40-80 | 31M | 23.9M | 874k | 29.9M | 190k | 0.79% |
| >80 | 5M | 2.8M | 1.2M | 3.6M | 181k | 6.54% |
| Total | 67M | 51.3M | 2.3M | 64.3M | 396k | 0.77% |
Table 3. The outcome of the age-structured SIRD model, loosely based on the UK.
Incorporating Vaccination - a Structured SIRVD Model
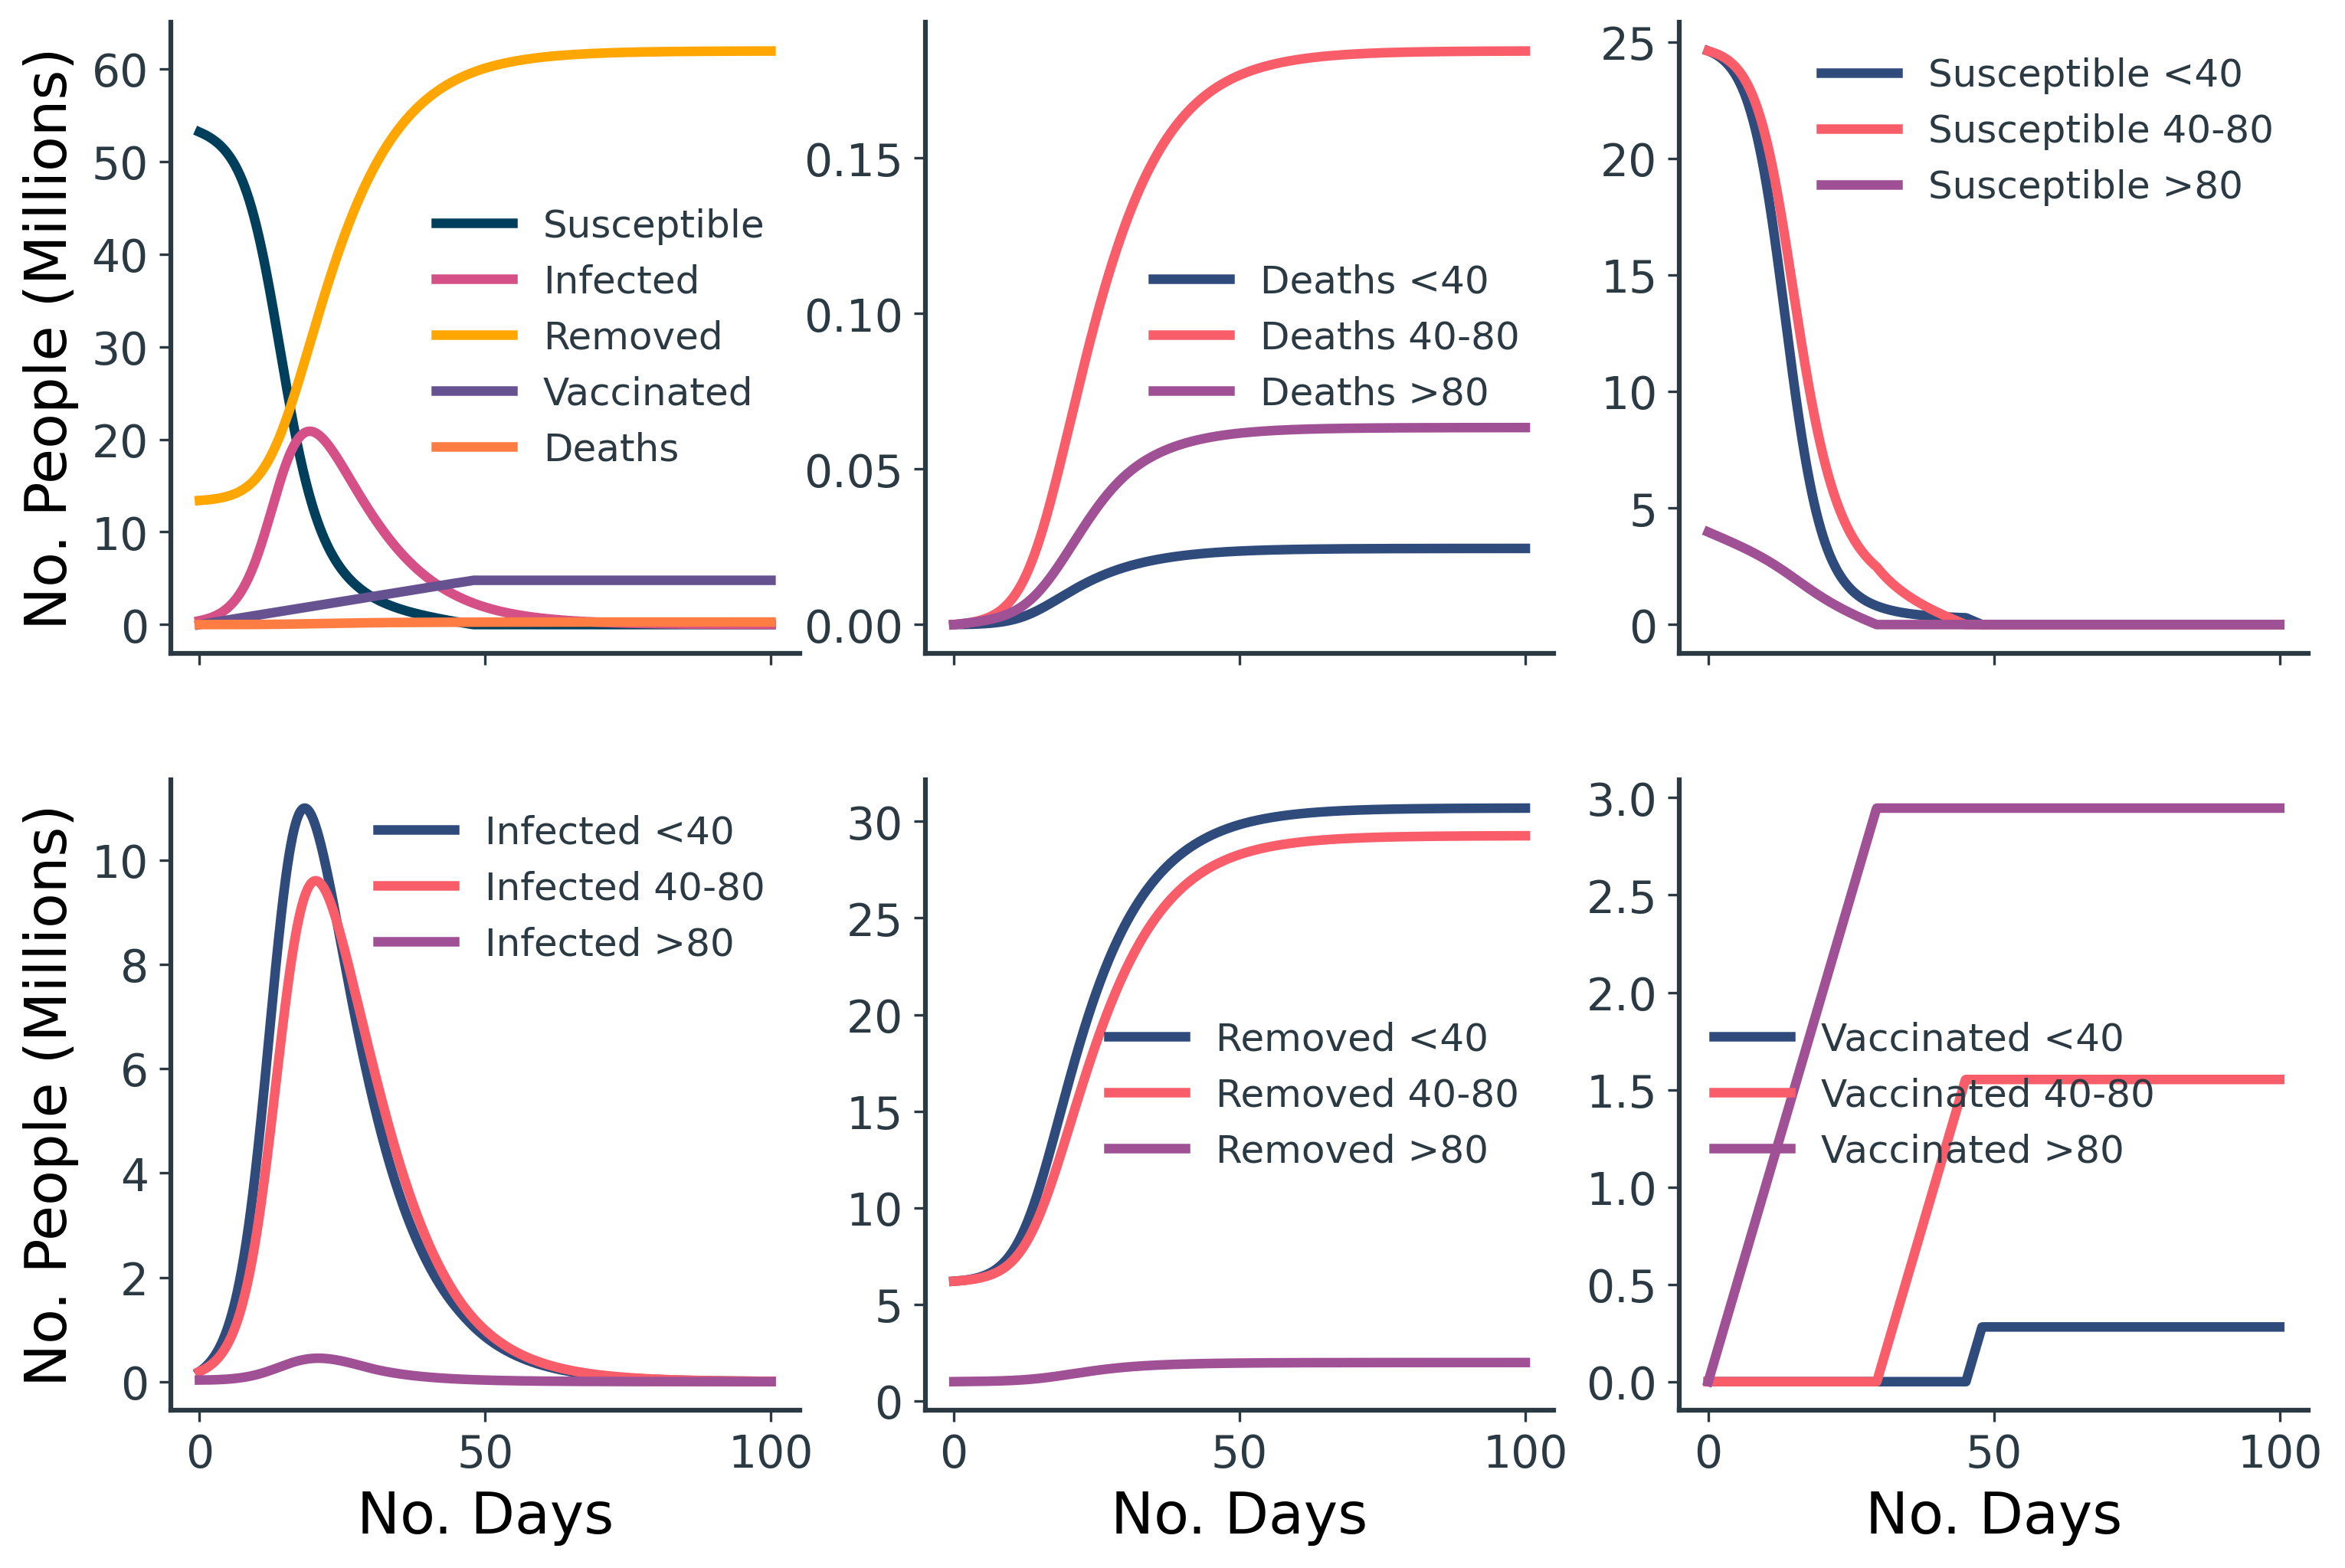
The final step is to incorporate a vaccination rollout into the model. This can be implemented by simply moving a fixed number of susceptible people, \( n_v \), to a vaccinated state, \( V \), at each timestep. Within a structured model, we can specify the order in which each group should be prioritised for vaccination.
For a vaccination campaign that vaccinates 100k people per day, in the order of oldest-to-youngest age group, we get the results shown in Figure 7. Just before 50 days into the simulation, there are no more susceptible people available for vaccination.
Part 2: Comparison of Old-First and Young-First Vaccination Strategies
So which strategy saves more lives - vaccinating the young or the elderly first? Based on Table 4, the answer is clear: start with society's oldest.
| End Deaths (Without Vaccination) | End Deaths (Young Vaccinated First) | End Deaths (Old Vaccinated First) | |
|---|---|---|---|
| <40 | 24.6k | 21.5k | 24.5k |
| 40-80 | 190k | 184k | 184k |
| >80 | 167k | 159k | 63.4k |
| Total | 381k | 365k | 272k |
Table 4. Count of deaths across the three age groups for different vaccination rollouts.
But is this the best metric by which we should quantify success? Some people insist that you cannot put a value on a human life. These people have never spoken to an economist. In fact, economists do this all the time, and conveniently, some have already done so within the context of COVID-19 and the UK. By considering discounted quality-adjusted life-years (dQALYs) instead of the raw count of deaths, we can devalue older lives in the sort of coldhearted but undeniably pragmatic way that economists are so fond of. Perhaps this perspective will favour vaccinating the young first? Table 5 shows the equivalent simulation results as Table 4, but this time based on dQALYs lost.
| dQALYs Lost (Without Vaccination) | dQALYs Lost (Young Vaccinated First) | dQALYs Lost (Old Vaccinated First) | |
|---|---|---|---|
| <401 | 408k | 358k | 407k |
| 40-801 | 1.3M | 1.3M | 1.3M |
| >801 | 334k | 318k | 299k |
| Total | 2.1M | 2.0M | 1.8M |
1For age groups <40, 40-80, and >80, one death equals 16.62, 7.04, and 2.00 dQALYs lost, respectively.
Table 5. Count of dQALYs lost across the three age groups for different vaccination rollouts.
Although the total dQALYs lost for the two vaccination strategies are relatively close now, vaccinating the elderly first is still the better option, even by this measure.
Part 3: The Outsized Impact of Superspreaders on Pandemics
It's no secret that the COVID-19 pandemic is in large part driven by superspreader events. Population-level measures like the basic reproduction number, R, mask the true complexity of how infection spreads (note: this is a different R to the 'removed' compartment discussed in our simulations).
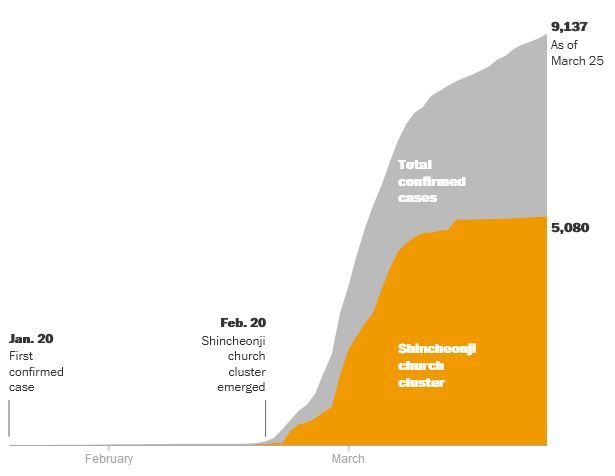
Transmission isn't uniform and equal across the infected population: a Pareto Principle-like effect applies, where the majority of transmission is due to a minority of individuals. Crucially, the impact of superspreaders outlasts the initial superspreading event - it propagates and irreversibly compounds throughout the entire pandemic. Countless COVID-19 superspreading incidents have been documented, including a South Korean church, the White House, and a Belgian Father Christmas, to name but a few.
The results of our simple UK-inspired models so far are clearly in support of vaccinating the elderly first. Our most-transmitting <40 age group is too surviving and insufficiently disease-spreading to justify prioritised vaccination. But are there superspreader scenarios where the targetted vaccination of small groups of extremely disease-transmitting individuals would achieve a better epidemic outcome?
For this final experiment, we retain the same <40, 40-80, >80 age groups as before, once again with populations of 31M, 31M, and 5M, respectively. But now, we also insert a group of 10k superspreaders. Given that superspreaders have a larger impact early on in an epidemic, we'll simulate this by assuming that only 1% of each group has already recovered from infection (previously 20%), and only 1/1600 of each group currently has the infection (previously 1/160). We'll keep the same rates of recovery and mortality as before.
| Group: | Superspreaders | <40 | 40-80 | >80 |
|---|---|---|---|---|
| S0 | 9,894 | 30,670,625 | 30,670,625 | 4,946,875 |
| I0 | 6 | 19,375 | 19,375 | 3,125 |
| R0 | 100 | 310,000 | 310,000 | 50,000 |
| γ | 0.1 | 0.1 | 0.1 | 0.1 |
| ω | 0.0001 | 0.0001 | 0.0008 | 0.0064 |
| β with Superspreaders | 20 | 20 | 20 | 20 |
| β with <40 | 20 | 0.3 | 0.13 | 0.03 |
| β with 40-80 | 20 | 0.13 | 0.17 | 0.07 |
| β with >80 | 20 | 0.03 | 0.07 | 0.08 |
| nv=100k vaccines per day. |
Table 6. Parameters used for SIRVD model with superspreaders, loosely based on the UK in an early epidemic scenario under lockdown.
In this scenario, we'll also simulate lockdown-like conditions by reducing our previous \( \beta \) transmission rates between age groups by a factor of three. We'll assume the newly-added group of superspreaders have \( \beta=20 \) with all groups, which is 67-250 times higher than all other pairings. Again, slowing the epidemic by emulating a lockdown makes the impact of superspreaders more pronounced. Finally, we run this simulation over a 365-day period rather than 100 days as before, as the lockdown-like epidemic scenario plays out over a longer timeline.
From the results in Figure 9, we see that mitigating the impact of superspreaders by vaccinating them ahead of more vulnerable individuals reduces the overall number of deaths, by flattening the curve™ and allowing for more people to be vaccinated before they become infected.
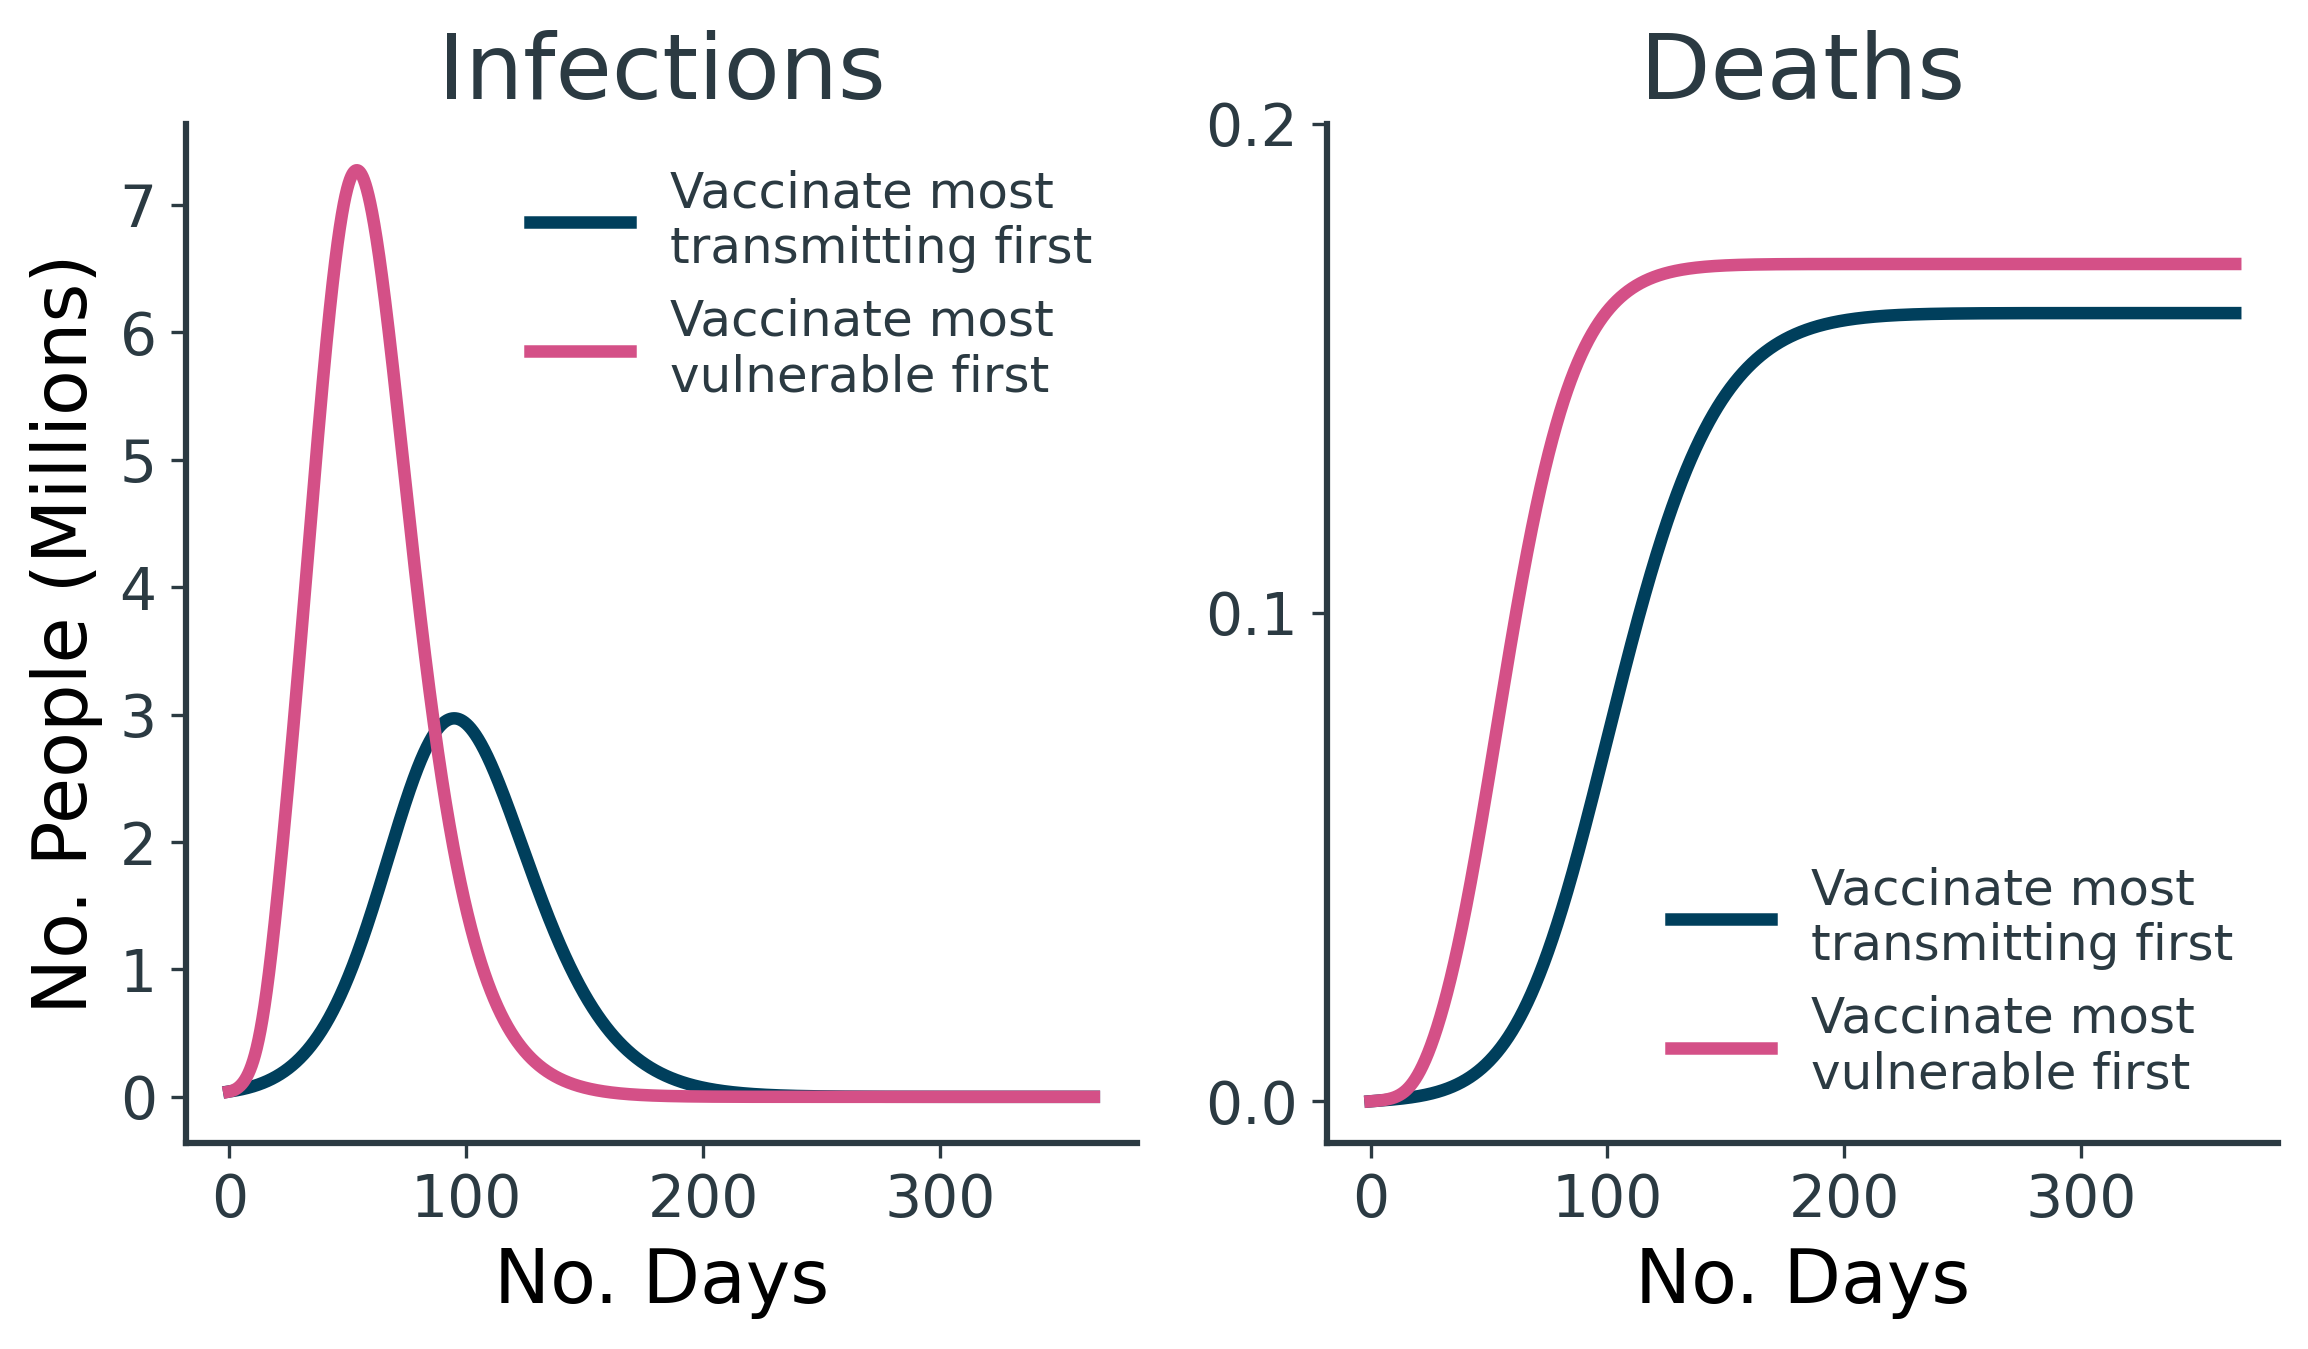
The prioritised and immediate vaccination of the 10k superspreaders results in 10k fewer deaths and 420k fewer dQALYs lost than vaccinating the elderly first (Table 7).
| Deaths (Most Transmitting Vaccinated First) | Deaths (Most Vulnerable Vaccinated First) | dQALYs Lost (Most Transmitting Vaccinated First) | dQALYs Lost (Most Vulnerable Vaccinated First) | ||
|---|---|---|---|---|---|
| Superspreaders1 | 0 | 9 | 0 | 150 | |
| <401 | 10.5k | 23.2k | 174k | 385k | |
| 40-801 | 100k | 136k | 704k | 960k | |
| >801 | 50.8k | 11.7k | 102k | 23.6k | |
| Total | 161k | 171k | 980k | 1.4M |
1For groups Superspreaders, <40, 40-80, and >80, one death equals 16.62, 16.62, 7.04, and 2.00 dQALYs lost, respectively.
Table 7. Count of dQALYs lost across the three age groups for different vaccination rollouts.
The astute reader might be suspicious of the strong deviations in modelling parameters and the change in the hypothetical scenario constructed for this simulation - and rightly so. These are the sorts of drastic changes that are necessary to engineer a result that favours vaccinating the most transmitting ahead of the most vulnerable. In all but the most contrived of scenarios, COVID-19 is so much deadlier for the elderly than for the young that vaccinating the oldest people first is unequivocally the best option.
By their nature, superspreading individuals are likely to become infected sooner than most, so there's only a narrow opportunity window early on in an epidemic to intervene. By the middle-to-late stages of an epidemic, the vast majority of superspreaders will have already become infected and their outsized disease-spreading will have been actualised.
In all but the most contrived of scenarios, COVID-19 is so much deadlier for the elderly than for the young that vaccinating the oldest people first is unequivocally the best option.
Of course, there are practical and ethical issues with this proposed vaccine rollout strategy. For one, how can you immediately identify this tiny group of virulent superspreaders? And even if you somehow could, would you be able to vaccinate them? What if they don't comply? One might suspect that "virulent superspreader" and "anti-vaxxer" are two sides of the same coin.
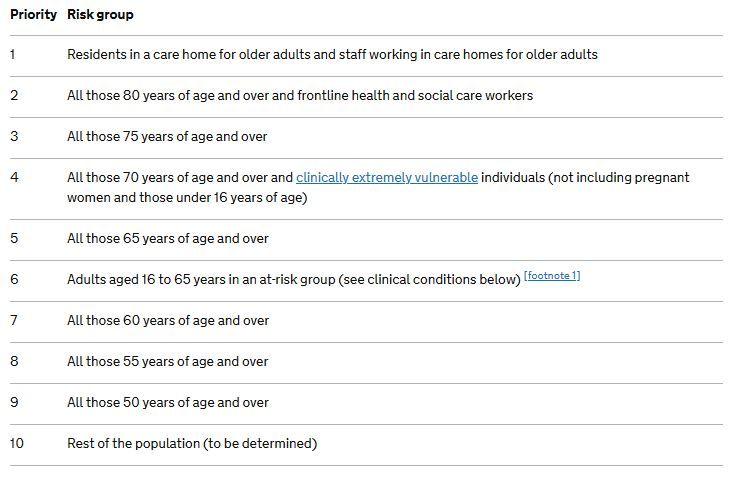
There's also no reason why we have to leave the elderly until last. The optimal strategy for this simulation would be to vaccinate the hyper-transmitting superspreaders first, followed by the remaining age groups in the order of oldest to youngest. This resembles strategies seen in the real world, such as the UK's rollout (Figure 10).
Conclusions
The limitations of these models are too numerous to list. They meet the minimum level of sophistication required to explore the question of vaccination prioritisation, but nothing more. Suffice to say, these models are far too simplistic for application to the real world - but they do allow us to arrive at some simple conclusions.
We started with a hypothesis that vaccinating less vulnerable but more disease-spreading individuals may achieve a better epidemic outcome than prioritising the vaccination of the more vulnerable but less disease-spreading. We assumed that these profiles mapped to young and old populations respectively, but found that vaccinating the old and vulnerable as a priority resulted in fewer deaths and dQALYs lost.
With these underwhelming results, we then exaggerated the idea into a full-blown superspreader scenario and found that under a more dramatic set of conditions, it would be preferable to hypothetically vaccinate (somehow) the small group of superspreaders as a priority. Even so, it still makes sense to vaccinate the most vulnerable in conjunction with these superspreaders.
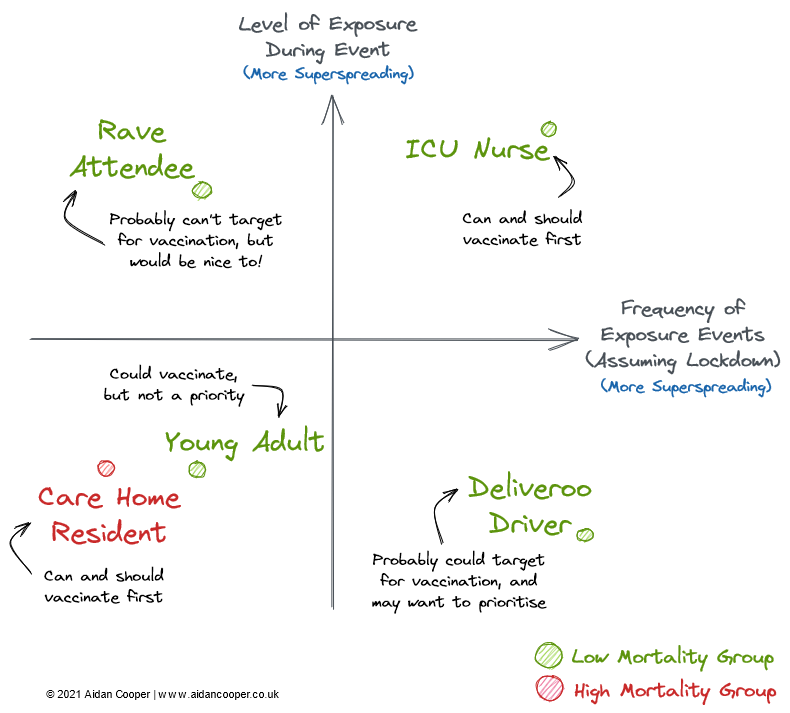
Are there any practical takeaways from this? Negative connotations aside, the characteristics of superspreading individuals are highly varied. An ICU nurse treating COVID-infected patients is a potential superspreader purely as a result of his vocation, as he is subject to a high number of high-risk exposure events. A promoter of unsanctioned lockdown raves is also an obvious superspreader candidate, as illegal raves are high-risk albeit relatively infrequent events. Conversely, a Deliveroo driver will have many potential exposure events, but each would be of low risk due to the limited contact time during interactions. We can map these profiles onto a superspreader matrix (Figure 11), where groups in the top right quadrant have the highest potential for superspreading, whereas groups in the bottom left quadrant are the least disease-transmitting.
However, as we've established, these two dimensions alone are insufficient to devise a vaccination strategy. We must also consider mortality rates, as well as the practical and ethical implications of targetting vaccination towards these groups. Both of these factors are orthogonal to the frequency and risk of exposure events axes.
So all things considered, we arrive at conclusions that reflect the vaccine rollouts seen in the real world. Namely, you should prioritise the vaccination of:
- Groups with considerably higher mortalities than the rest of the population (the elderly and the clinically vulnerable)
- Groups of lower mortality, but with frequent exposure to high-risk events - particularly those that interact with vulnerable individuals (frontline healthcare workers)
- And perhaps - at least during the earliest stages of an epidemic: highly-connected individuals, regardless of mortality, with frequent but low-risk exposure events ("essential workers": delivery drivers, supermarket employees, etc.)
 AidanCooper
Code for this analysis can be found on GitHub
Member discussion